Ok, I’ll just progress ahead as planned then and continue to memorize the major system as I’ve been doing and continue to try to apply it.
I looked for old posts on this topic and didn’t find much.
One thing that was interesting was posted here about coming up with alphabet pegs and number pegs for columns and rows, respectively to help memorize the structure of a table. Wondering if there’s merit to doing this vs just memorizing things the standard way.
I can’t er… remember where I saw this method originally. It might have been on Memory-Sports.com, but I couldn’t find it when I just did a quick search.
It was something along the lines of using alphabet pegs as columns and number pegs as rows.
So the table structure might look something like this:
If your alphabet peg images are something like:
A = ant
B = bee
C = catand your number pegs are something like:
1 = candle
2 = swan
3 = handcuffsThen you would attach images A and 1 to cell A1, images B and 2 to cell B2, etc.
I haven’t tried it exactly like this – just passing on the concept that I read about.
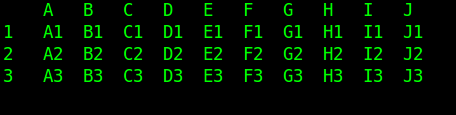

*Source for above: here
*
Someone also suggested coming up with specific images for specific financial terms (i.e. EBITDA, Cash Flow, Revenue, Net Income, etc.)
The way I see it, my options are as follows:
- Major System: Link YEAR (eg. 2022) –> Dollar Amount (eg. $200), but not discretely an image for the metric, just the number
- Major System: Link YEAR (eg. 2022) –> Financial Metric Image (eg. Revenue) → Dollar Amount (e.g. $200)
- Use the alphabet peg and column peg idea quoted above, but add an additional row and column so that the B1 and A2 for the Date for which the figure applies.
- Not sure if this would be more onerous, but I do wonder if over time it would be easier to “see” the whole table in my mind, or if it would be like looking something up with a column and row reference to triangulate the piece of data I need
Do you or anyone else have any thoughts on the best approach for any of the above based on your experience?
Thanks!