Memory systems to memorize financial details and KPIs?

Hello all,

So, I work in finance and a core part of my job is to remember a lot of numbers, examples include:

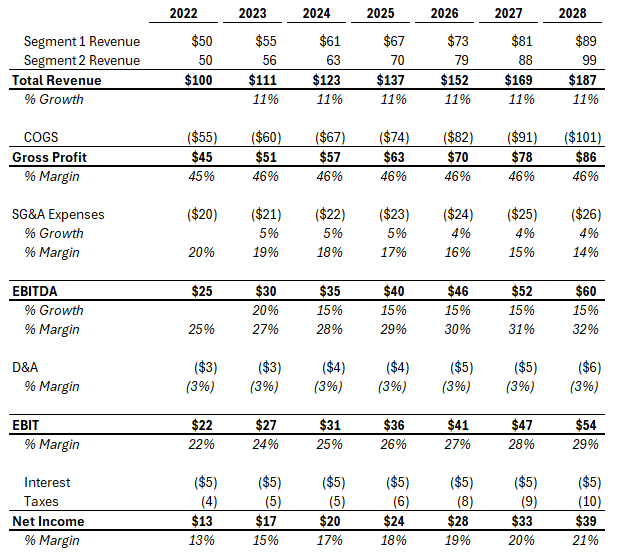
  • Revenue by year historically and projected, sometimes also by business segment
  • Revenue growth rate by year
  • % Margins (so the ratio of one financial stat in relation to another, i.e. 50% EBITDA margins)
  • Industry size and growth rate
  • Terms of a deal (eg. how much was paid for a company, how much cash was put down and how much debt financed, interest rate on financed debt)

If I had to abstract it, I’d say there’s three types of items I need to memorize high level

  1. Year over year metrics and their growth rates
  2. Ratios (often percentages or sometimes multiples (e.g. 200/100 = 2x)
  3. Standalone point-in-time metrics

I’ve recently gotten into memory tricks and have been trying to use the Major system and PEG system, which lead me to the discovery of the PAO system.

Is this PAO system well suited for this sort of thing? If so, would folks mind explaining how I might approach this (outside of setting up the PAO associations themselves)? If not, are there any other systems that you’d recommend? I’m tired of not being able to remember numbers, even when contextual when I should be able to otherwise.

Thank you!

Sorry adding an addendum here since it looks like I can’t edit my original post.

Another example could be memorizing a table of data year by year, so for example

Revenue on 2022, 2023, 2024, etc.

Gross Profit in those same years

Cash Flows in those same years, etc.

The truth is that the PAO or MAJOR system is fine for this. You can also create personalized images for symbols such as @ a caterpillar or snail… and so on for any other symbols you need.

Memory systems are a figurative art, so the images must be created by the memory artist himself from the things he possesses, such as TV series, movies, artists, etc. So take all of that and create your list, whether it’s major or PAO.

Make the scenes comical, sensual, or horrific. This will help you remember the scenes more vividly. Also, give them movement.

There is a lot of information about the PAO or larger system. You can find articles on the subject in this forum.

PAO
MAJOR SYSTEM

2 Likes

Ok, I’ll just progress ahead as planned then and continue to memorize the major system as I’ve been doing and continue to try to apply it.

I looked for old posts on this topic and didn’t find much.

One thing that was interesting was posted here about coming up with alphabet pegs and number pegs for columns and rows, respectively to help memorize the structure of a table. Wondering if there’s merit to doing this vs just memorizing things the standard way.

I can’t er… remember where I saw this method originally. It might have been on Memory-Sports.com, but I couldn’t find it when I just did a quick search.

It was something along the lines of using alphabet pegs as columns and number pegs as rows.

So the table structure might look something like this:

If your alphabet peg images are something like:

A = ant
B = bee
C = cat

and your number pegs are something like:

1 = candle
2 = swan
3 = handcuffs

Then you would attach images A and 1 to cell A1, images B and 2 to cell B2, etc.

I haven’t tried it exactly like this – just passing on the concept that I read about. :slight_smile:

*Source for above: here
*
Someone also suggested coming up with specific images for specific financial terms (i.e. EBITDA, Cash Flow, Revenue, Net Income, etc.)

The way I see it, my options are as follows:

  1. Major System: Link YEAR (eg. 2022) –> Dollar Amount (eg. $200), but not discretely an image for the metric, just the number
  2. Major System: Link YEAR (eg. 2022) –> Financial Metric Image (eg. Revenue) → Dollar Amount (e.g. $200)
  3. Use the alphabet peg and column peg idea quoted above, but add an additional row and column so that the B1 and A2 for the Date for which the figure applies.
    1. Not sure if this would be more onerous, but I do wonder if over time it would be easier to “see” the whole table in my mind, or if it would be like looking something up with a column and row reference to triangulate the piece of data I need

Do you or anyone else have any thoughts on the best approach for any of the above based on your experience?

Thanks!

Combine systems, with the middle or final ones representing numbers and the first ones representing letters, or create categories within memory palaces, for example kitchen objects, museum, etc., but in alphabetical order.

Combine systems, with the middle or final ones representing numbers and the first ones representing letters, or create categories within memory palaces, for example kitchen objects, museum, etc., but in alphabetical order.

Sorry Magno, would you mind expanding on what you mean in both examples? I’m not sure I fully understand. I’ve included an example of the types of data that I would need to memorize below and the format.

Really appreciate your help here.

For the years, use the major system and place it in the middle of a palace, representing that year.

For the rest, create the following: statues. For Growth, create the image of the (gr)inch; for Margin (Mar)ge, etc. Remember that to avoid confusion, you should create more images that represent these words, but I will give you the following tip so that it is not a laborious task: Marge has an afro and blue hair, so look for people you know who are actors and so on, and pin them with blue afro hair like Marge’s, and you will know that they mean “margin.” This way, you can add more symbolic actors.

Now place the data and percentages around this and this around the year that concerns you. If the data tends to repeat itself, create actions that represent this, that is, actions from below will represent that the data repeats itself. You can also create this by choosing a letter to search for objects or things that represent repetition, such as the letter “R.” From there, look for objects or things to represent repetition.

The data for certain years can fit in a room and even on a single wall, which you can divide according to the data, for example into 9 sections. The image in the middle of the wall represents the year, and the others can be read from left to right.

Group the information as follows:

2022 → Nick Robinson riding a wild boar (my number system) → This will be in the middle, since the wall is divided into 9.

Total Revenue: $100 (11% Growth) → Metal venue (use a rock artist), for 100 I will use Rhys Darby (numerical system) and the Grinch holding a lynx.

Do the same with the others, put them on the wall, remember to create more images for repeating data, or create some distinctive action… each year should be in a room, you can search for house tours on YouTube and use them as palaces or house rental websites that allow you to have a 360-degree view, this is better.

Each year has 10 data groups divided by 5 = 2, so on each wall you will put a group of images on each side, that is, divide a wall in half, there are 5 including the ceiling. If you use locations such as chairs, windows, etc., place the groups of images the same, that is, left and right.

I hope this gives you an idea. You can take the image and send it to ChatGPT to make these types of groupings, which are visually more pleasing to work with for memorization.

This is a very helpful starting place.

Thank you very much!

1 Like

Did you end up using any mnemonics at work? I also work in finance and find that there are too many numbers to memorize. Some advice I received recently was to remember the range a number falls in. For example, a company’s revenue is between 100 and 150m, not 10 and 15m. That kind of ballparking goes a long way.

good advice. I haven’t implemented anything effectively yet…

I’ve developed a peg list that I have memorized from 0-100. It works in theory, but I’ll regularly get numbers mixed up. For example, if 2021 = net (mnemonics for 21), then I’ll have revenue & EBITDA of 713 and 161. Each of those will have their own peg list numbers, but then I’ll Mix up the peg list stories since they both start with 21. The way to counter this might be to do year –> Metric –> number, but implementation of this is new for me and I’m just doing it in my spare time. I suspect there’s some version of this that is possible for our professions, but it will take a lot of practice to get to the point where it’s second nature…

Aristotle’s Categories and Their Application to Mnemonics

The Ten Categories

  1. Substance – The essence or identity of something.
    Example: a man, a horse, a house.

  2. Quantity – How much, how many, or how large it is.
    Example: its size or number.

  3. Quality – The characteristics or appearance.
    Example: rough, smooth, white, shiny.

  4. Relation – How it compares to something else.
    Example: half as big, twice as tall.

  5. Place – Its location or position in space.
    Example: to the east, inside or outside, on the first floor.

  6. Time – When it exists or occurs.
    Example: on a certain day, at a certain hour, long ago.

  7. Position – The posture or arrangement of the subject.
    Example: sitting, lying down, standing.

  8. State – The condition or circumstances it is in.
    Example: armed, clothed, asleep.

  9. Action – What it does or how it behaves.
    Example: running, jumping, speaking.

  10. Affection (Passion) – What happens to it or what it experiences.
    Example: being hit, burned, or affected by an external cause.


How to Use These Categories in Mnemonics

To strengthen your memory images, use Aristotle’s categories as creative lenses for transformation.
Take a simple image—say, a banana—and reshape it using one or more categories. This prevents monotony and enhances vividness, just as a painter or sculptor modifies form and texture.

Example

  • Substance: The banana itself.
  • Modified by Substance: A banana with shark teeth; a man with banana-shaped teeth; a banana-shaped ship.
  • Modified by Quality: A golden banana (touched by Midas), a black or red banana, a banana that explodes like a bomb.
  • Modified by Relation: A banana twice the size of a monkey.
  • Modified by Action/Affection: A monkey peeling a banana, or a banana being peeled by a robot.

Each variation engages different senses and logical connections, reinforcing the memory trace.


Emotional Amplification in Memory Images

Emotional impact enhances retention. Use images that provoke strong feelings—fear, wonder, laughter, or disgust. Aristotle’s categories of Action and Affection naturally extend into this realm of emotional imagery.

Four effective emotional modes:

  1. Cruel – Scenes of pain or violence.
  2. Ridiculous – Comical or absurd situations.
  3. Miraculous – Supernatural or extraordinary events.
  4. Shameful or Repulsive – Embarrassing or immoral behaviors.

By linking abstract ideas to vivid, emotionally charged images, you transform neutral information into memorable experiences.

The only memory book which I’ve seen covers this a bit is Harry Lorayne’s Memory Makes Money book.

In the book he also has Arthur Levitt the erstwhile Chairman of American Stock Exchange talk about how he used ideas to memorize market information.

1 Like